Run Data Profiling
Enabling DQLabs in erwin Data Intelligence (erwin DI) allows erwin Data Quality APIs to pull environment connection information from erwin DI and create catalogs in erwin Data Quality. You can add datasets to the catalogs and run data profiling.
Once the data quality analysis is complete, erwin Data Quality displays data quality analysis for catalogs (environments), datasets (tables), and attributes (columns). You can sync the analysis results to erwin DI and view them in the Metadata Manager.
Data quality analysis is available for environments using Oracle, Salesforce, Snowflake, MySQL, MSSQL, Hadoop, and PostgreSQL database types.
Before running data profiling, ensure the following pre-requisites are met:
- Configure erwin Data Quality in erwin DI. To configure erwin Data Quality, refer to the Configuring Data Profiling topic.
- Switch the Enable DQ Sync option on for the environment. To enable this option, refer to the Managing Environments topic.
This topic walks you through adding datasets and running data profiling on the catalog for Sql Server database as an example. Similarly, you can run data profiling for other databases.
To run data profiling on a catalog, follow these steps:
- Go to Application Menu > Data Quality.
Your erwin Data Quality instance opens. Login to erwin Data Quality (if asked). - On the erwin Data Quality menu, click the user icon.
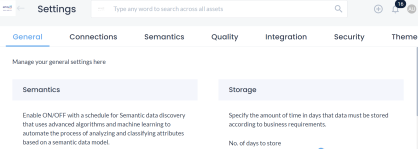
- Under the user icon, click Settings.
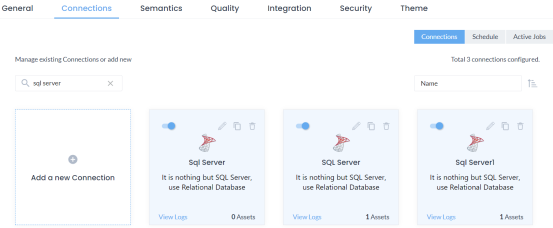
- Click Connections.
- In the search box, enter the environment name for which you switched on the Enable DQ Sync option in erwin DI.
- To edit the environment connection details, click
 .
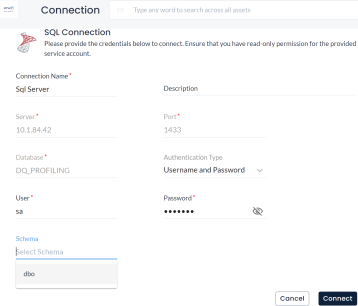
. - Enter or select appropriate values in the fields. Fields marked with a red asterisk are mandatory. Refer to the following table for field descriptions:
-
Username and Password: Specifies the standard authentication method where users log in using a unique username and a secure password.
-
Windows Authentication: Specifies the authentication method that leverages Windows credentials to authenticate users based on their Windows login information automatically.
- Click Connect.
- Select the required datasets and then click Connect.
- On the catalog configuration page, under the Actions column, use the following options:
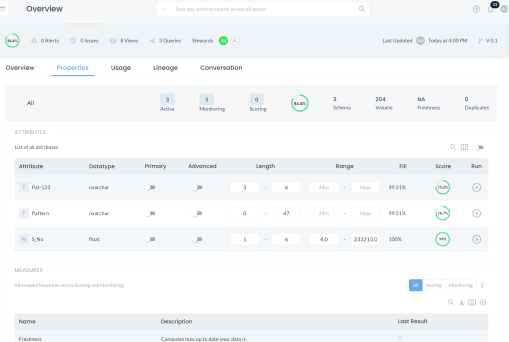
- Click the Properties tab to view a list of all attributes and DQ scores.
![]()
The Settings page appears.
For example, in the following image, 3 results are displayed for the keyword sql server.
The Connection page appears.
|
Field Name |
Description |
|---|---|
|
Connection Name |
Specifies the name of the connection. For example, Sql Server. This field is auto-populated with the connection name. You can edit the name as required. |
|
Description |
Specifies the description of the connection. |
|
Server |
Specifies the server number. This field is auto-populated with the server number. |
|
Port |
Specifies the port number. This field is auto-populated with the port number. |
|
Database |
Specifies the name of the database. This field is auto-populated with the database name. |
|
Authentication Type |
Specifies the type of authentication. |
|
User |
Enter the username. For example, sa |
|
Password |
Enter the password. |
|
Schema |
Specifies the name of the schema. This option is available only by clicking Connect after entering your username and password. |
The catalog configuration page appears and displays the datasets in the catalog.
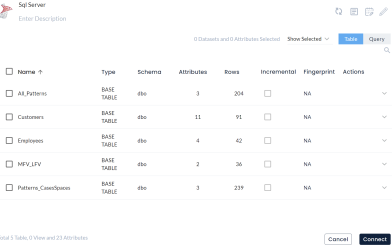
You can use the check box at the top to select all datasets.
Data quality analysis might take some time, depending on the size of data in the catalog. You can click the View Logs icon to view the status of the dataset.
Schedule (
![]() ): Use this option to schedule a data profiling job at predefined intervals.
): Use this option to schedule a data profiling job at predefined intervals.
Delete (![]() ): Use this option to delete the dataset.
): Use this option to delete the dataset.
After profiling data, the Explore page appears and displays data quality analysis of the datasets in a card format. Each card on this page displays the asset names, attributes, rows, DQ scores, alerts, and issues.
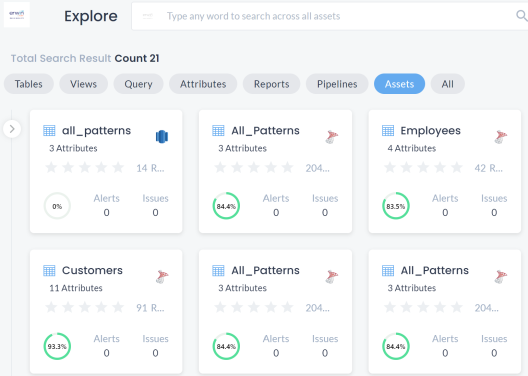
You can drill down to view detailed information. For example, click the All_Patterns card.
The Overview page appears and displays the DQ score and detailed information on the dataset.
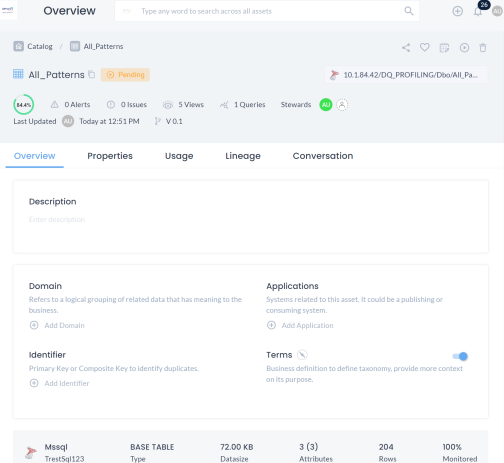
Also, you can drill down to view DQ scores for attributes.
You can sync these results to erwin DI and view them in Metadata Manager. To sync data quality analysis results, you need to schedule a sync job. For more information, refer to the Scheduling Jobs topics.
You can further drill down to view the detailed analysis of an attribute. To view the detailed analysis of an attribute, follow these steps:
- Under the Properties tab, click the Select Attribute filter and select the required attribute for which you want to view the detailed analysis. Alternatively, you can click attribute under List of all attributes.
The Properties tab for the attribute appears. Also, you can view a comprehensive analysis of the data in tabular format and charts under the Profile section. For more information on charts, refer to the Data Quality Charts topic in the erwin Data Quality user guide.
|
Copyright © 2026 Quest Software Inc. |